This past weekend I was working on my side project (which is a secret, sorry!) and I was trying to find a good way to organize the issues in priority order. I came across a fantastic article on the Atlassian Agile Coach which presents a system for estimation using issue weights ranging from 0 to 100.
The special thing about this range is that it’s comprised of numbers roughly adhering to a Fibonacci sequence, like so:
0, 0.5, 1, 2, 3, 5, 8, 12*, 20, 40, 100
*In the article this value is 13, but I changed it to 12 because that’s a workday-and-a-half and made more sense.
So it’s not too far of a leap to translate these weights to man-hours of effort. In other words, I realized that an issue with a weight of 8 should take me one full work-day to complete.
I liked that paradigm, so I made a bunch more:
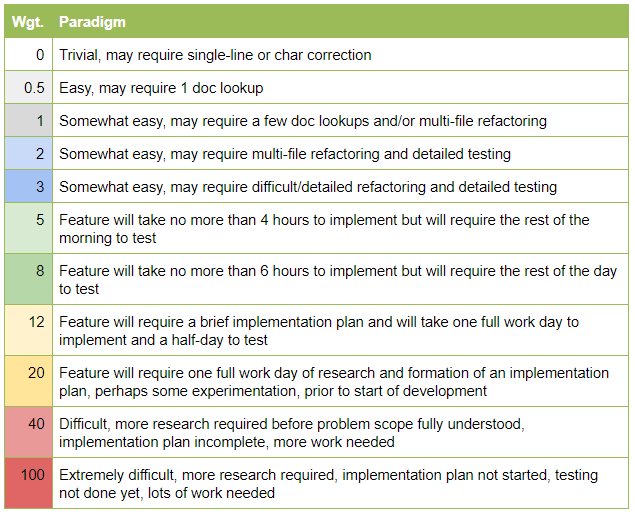
So what do we do with this data? Well, besides providing a decent time estimate for the issue, issues can be sorted by weight and organized into sprints. We can also make burndown charts, which are super cool:
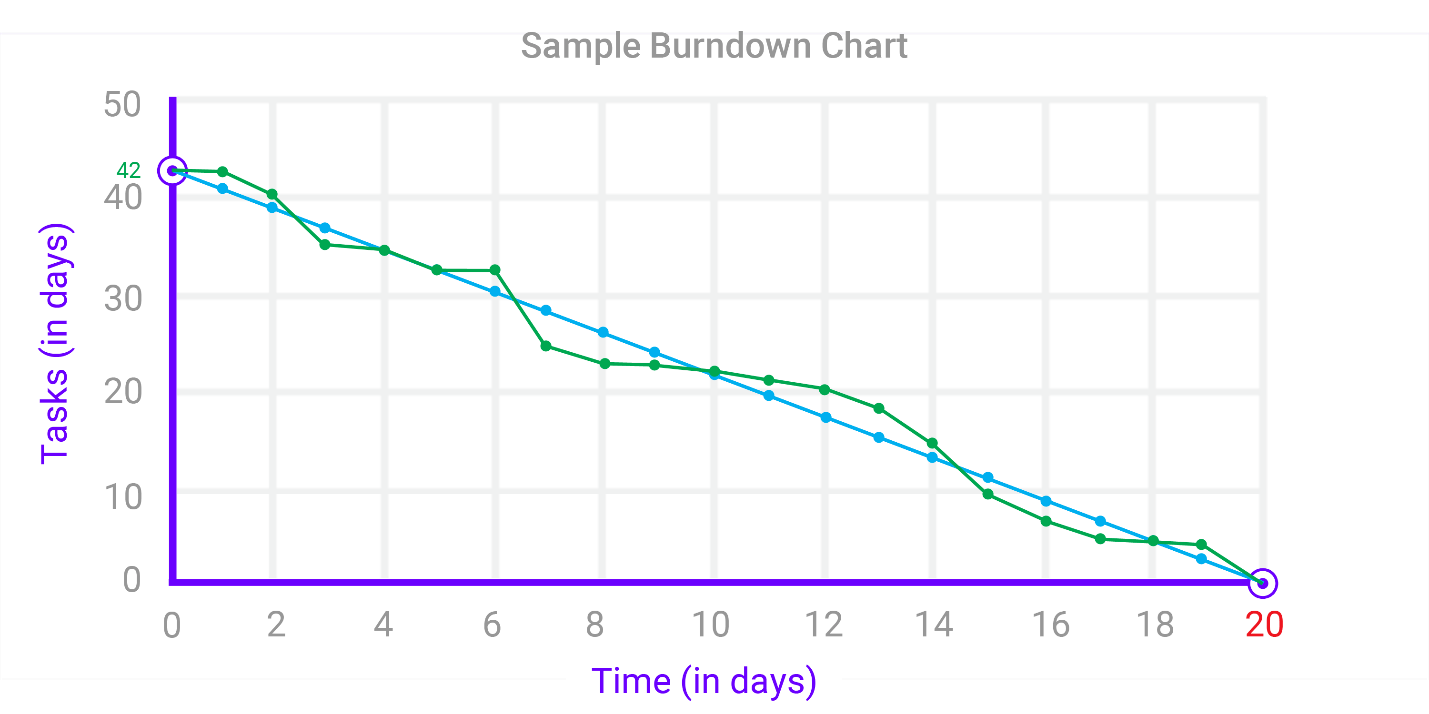
So here we can see the project is on progress, with some slight deviations in ticket times around days 6-8. This kind of information is valuable to managers to see where bottlenecks are.
Leave a Reply